Here are my raw session notes, with in-line photos of slides, for the GDC talk Advanced Data Mining and Intelligence from Large-Scale Game Data, by Bruce Ferguson of SOE and Dmitri Williams of USC. This is my best attempt at a transcription of everything they said. Any mistakes or misinterpretations are mine and mine alone. My own comments are in [square brackets].
This talk was super interesting and information-dense, so my notes are LONG, and illustrated. Enjoy.
—
[Bruce goes on first.]
USC approached SOE asking for data, we said, “yes we have data, what do you want to do with it?”
We’d done some data mining but were excited to have outside help. The industry needs outside help — we’re busy making content, it’s helpful to have an outside source doing this. We were happy for there to be additional r+d.
As we went into the process we realized there were lots of challenges. Legal ramifications about sharing data of our customers. It was a long process making sure it was fully NDA’d, with requirements for destroying data. We had to scrub personally identifiable data. Raises problems with your community — as soon as people are aware of this, they get concerned, so there were apsects we had to be very careful about to not anger the community.
When we built eq2 we had not designed the logfiles for this kind of thing.
Some of our logfiles here: [looks like key-value pairs]. They’re kind of complex to read, lots of data happening even in second intervals. The amount of data gets fairly large fairly quickly. As eq2 we do storage for recent data, then we ship things out for offsite storage. It’s a struggle to pull it back in and scrub it.
We don’t want to show them exact chat logs, but we do want to show who is talking to who. You’ll see info about who is talking to who, if they’re on different servers. And for EQ2 being SOE, there’s a universal API through all our games, it’s not even in the game logs but separate log files.
We didn’t write any of the logging for people to do analysis on it. As soon as we provided data they had to parse through and figure out what it actually means. Cross-sectional data: cumulative state of world records, account-level info, retention and subcription. Subscription was the easiest thing for researchers to work with. It was the easiest part, it was straightforward, not related to random things about what’s going on in the game, so this was pretty easy.
Now we look at survey data.
[Dmitri takes the stage]
Survey data is usually where we start and stop in academia, so we’re used to it. We’re not usually used to this much data. We got to do a survey of the players, to get an idea of who the player base is all. When we do surveys in academia we pay people and get 20-30% response rate. SOE made the survey an in-game item, no pay, and it was very popular.
We get a rare combo of behavioral and survey data.
We used a supercomputing farm. We logged in and out of the farm and used a SQL interface for basic queries. In many cases we have standard ways of doing things but they never worked at this scale of data before so we needed to do custom code. When you get into billions of rows you need new algorithms.
What’s the cost of this kind of work? You need storage at 3:1 ratio (1TB of data, need 3TB of space.) So they needed 30TB of rack storage for the 10TB of data. Paid for one half-time coder at the supercomputing center. The team that analyzed the data was 20 people across 6 universities (phd students and professors). Where does money come from? The project is paid for by grants from outside agencies (NSF and the Army). About $1.5M for 20 people over a three year period.
On one side there’s consultant services aspect, on the other side the service is entirely free, but the upside is that even though you need to provide us the data, the data IS our payment so it’s cheap for you.
Here is some low-hanging fruit on survey data.
Who plays? Everything I show you is for EQ2. Maybe not representative of all games.
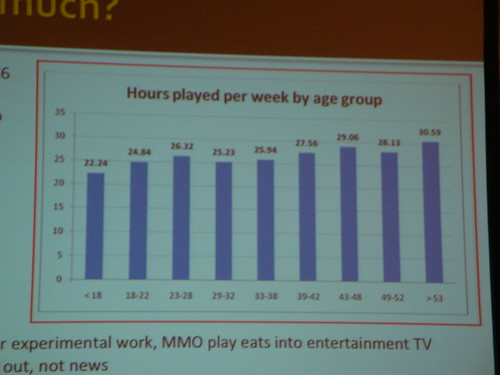
As a rough trend, older players play more hours/week. We think that’s because there’s not a lot of other ways for older people to make friends in modern society.
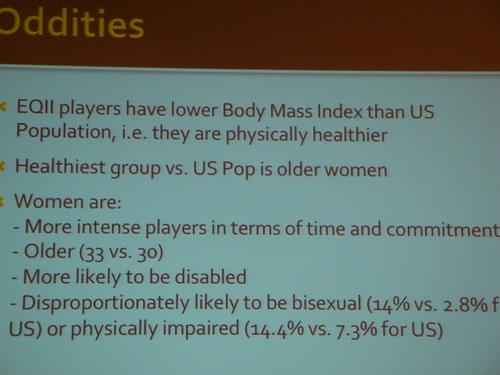
EQ2 players have lower BMI! Healthiest group was older women. 80/20 split of wom/men. Women are older, healthier, more intense. Disproportionally likely to be bisexual.
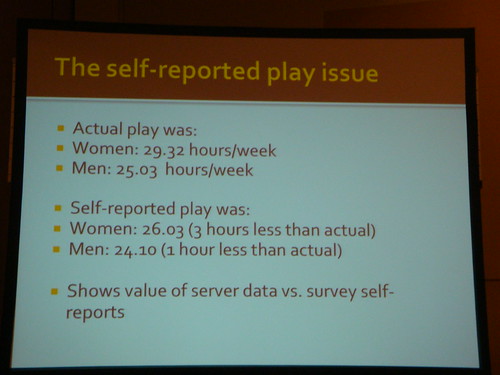
Reporting accuracy:
Self reported play
w: 26 hours/week
m: 24 hours/week
actual measured hours of play:
w: 29 hours/week
m: 25 hours/week
Everybody underreports hours played per week. This is systematic, there’s a social stigma. The other thing is that the women underreport at a larger rate than the men do. If there is a social stigma it falls more heavily on women than on men.
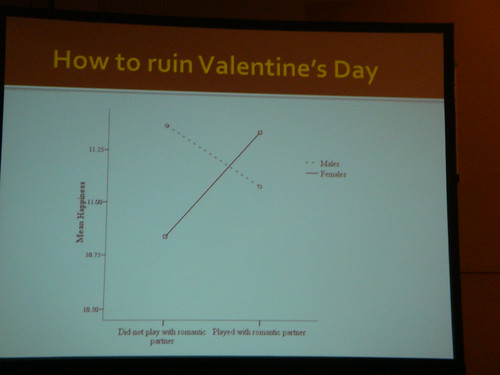
When men + women play together, it sucks for the men, and is great for the women. Men who play with partners less happy than other men. Women are happier when playing with partners. What’s good for the goose is not good for the gander. The vast majority of female players are introduced to play by males.
We also looked at role players. Looked at survey data and behavioral data. The hard statistical stuff did not provide a lot of context, so we used surveys to provide that. No one approach will answer all questions, so these are complementary.
When we asked players how often you roleplay, not many are hardcore RP. About 5%. It wasn’t different from server type to server type, regardless of whether it’s an RP server or not.
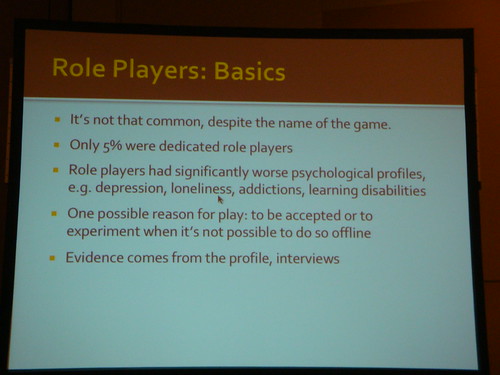
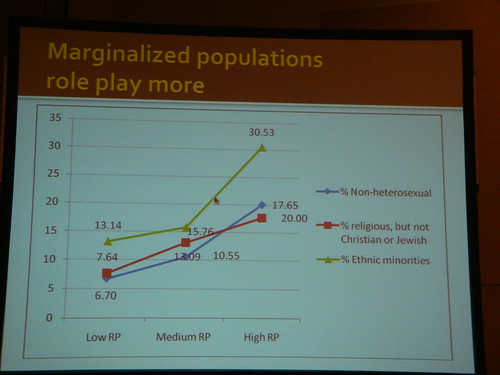
RPs have siginificantly worse offline psychological profiles (we did interviews with them). They come online not to run away from problems, but rather to deal with problems therapeutically. Many of them are disabled in real life, or not as accepted offline than online. When you go online you are anonymous, which can mean less depth of relationships but you are not judged [really?]. The people who RP the most come from the most marginalized populations, race, sexualities, faiths.
Game-side analytics
We did some big aggregate tests, combinations of a single value over a month. Just proof of concept. Simple aggregates are nice to do for economy. What was the in/out cash flow? Once we had that, we thought of data that could help both economists and game devs.
GDP? The economy log is the single biggest log in the EQ2 db.
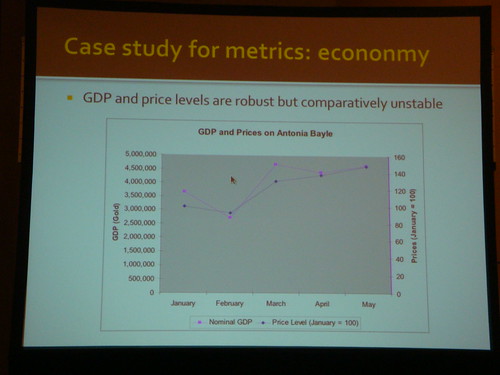
When I first made this chart, I thought that it was unrealistic because in the real world we don’t see big changes in GDP, but now we know this happens a lot in MMOs! (Similar to Weimar germany, actually.) Lets us test some theories: we want to know if we can use this data to make predicitions. Are people going to behave rationally? This is a tenet of economists and a huge area of debate, yet it’s hard to test this in real world. But in this situation you get to track every last copper piece. So we took everything. There’s a basic theory aboout supply/demand: you should be able to predict how much things cost based on how many people there are and how much money there is.
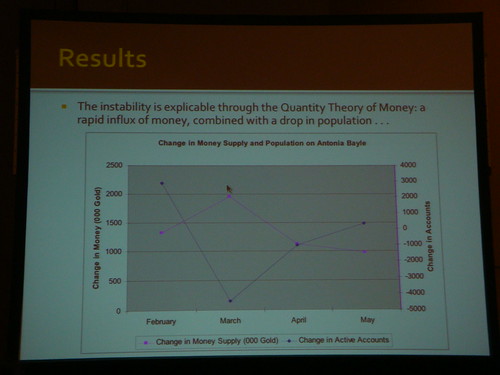
You can see that money went up and people went down one month. We expect to see prices go up, and THEY TOTALLY DID! People did behave rationally. We hope this is useful for you guys to look at economic stability.
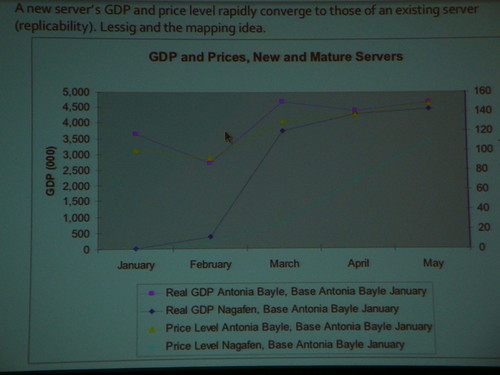
What about multiple servers? In this case we have a natural experiment: if a server comes online and it behaves like prior servers, people act the same way on each world. You can see that’s the case. It’s a nice proof of Lessig’s work that code is law, people follow your patterns.
People are interested in finding farmers. We start with customer support team. Identifying four kinds of farmers: levelers, mules, spammers, traders (middlemen). We only started doing this 1.5 weeks ago so we only have 6 days of data so this is not even preliminary work.
Criminals are dumb. Lots of them are from Antarctica, Alaska, Alabama! High likelihood that people who claim to be from those areas are farmers. Cat and mouse game, ban IPs people are from, but of course people can change IPs. 3 ways to track farmers:
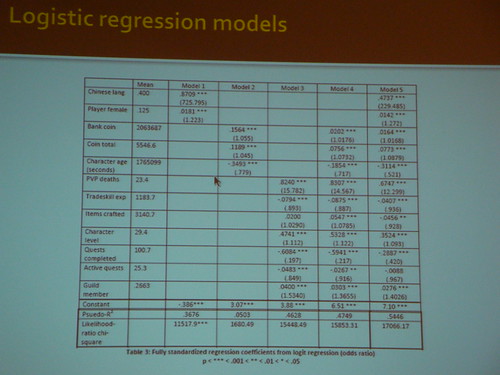
Use regression models: x+y+z+a+b (just weights on farming likelihood).
Also, graph data and look for patterns. Number of seconds they played the game multiplied by the level they’re at (power leveling metrics).
Second method: use brute force pattern matching. Look for common behavior between banned people, now you have a behvaior model. (have not actually done this yet, working on it)
We do have to rely on those who have been caught, and assume that those who have been caught are similar to those who have not been caught.
3rd method: social network analysis. Looking for basic patterns of interactions between people. “Network signatures” what they’re called. What we can do is take the network graphs we generate form the game world and look fro these patterns. If we can establish farming signatures, that’s actually mathematically fairly trivial to do.
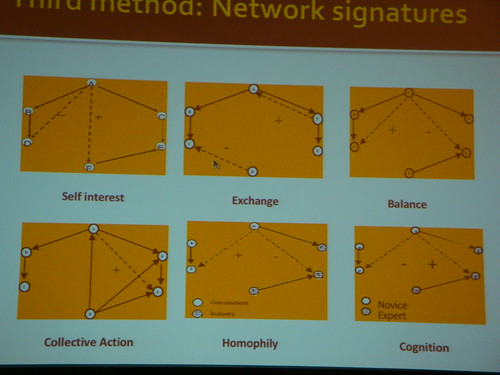
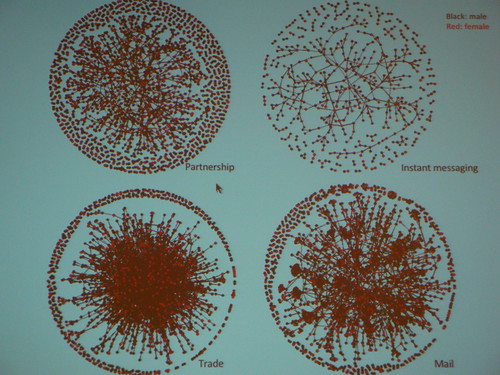
The ecology of each behavior network is different. Trade networks have a ring of people who only interact with just each other, and then there are people in the middle who are part of the hub and spoke system in the middle. [that's a very heavy computation]
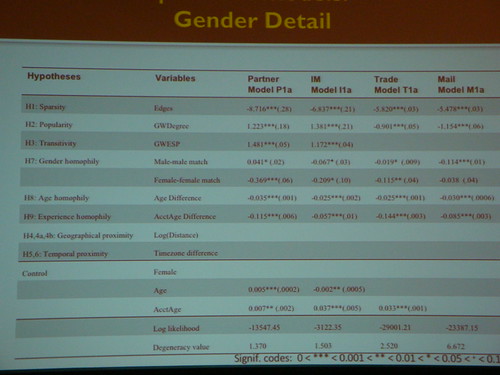
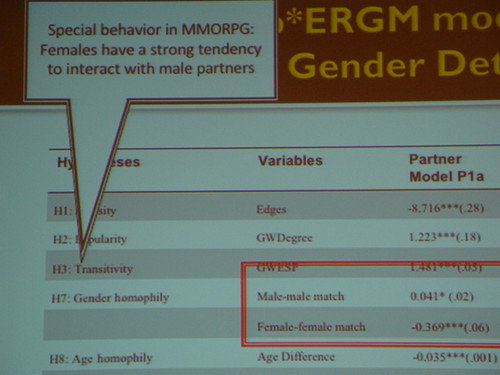
P*ERGM (p star exponential random graph model) to run on the graph and find coefficients still. The extent that people will group with those of their same gender: what it shows is that once you account for the 80/20 gender split, the female players are less likely to group with females and more likely to group with males. They will often play with their male partners. Big gender difference here.
People use internet to connect with people they already know, not really strangers. Are MMO players meeting new people, or playing with existing friends? Breadth vs depth of relationships. One way to check this is to ask them how often you play with friends/relatives, a pretty high number of people, 35-45% of people are playing with someone they already know. We can look and see if people are geographically close (using IP). We see how close they are using geo lookup table and seeing how far away they are. [of course you could be with friends far away] but the single biggest predictor pof people playing together is geographic proximity! [there's also time zone stuff to consider]
Basic group-level analysis
There’s no good way to say who is in a group together, so you have to make assumptions to what makes a group. It’s people who gain XP together. Our table is from single week of data, in Aug 06. Are groups consuming the right amount of content? Group size * unique numbjer of groups = % of units of content. 16% of units of content for 1 person groups. 6 person groups have the largest % of XP events — but for big raid groups it’s misrepresented because in raids you just get xp less often than small groups killing mobs of rats. Also maxed otu raid groups get no Xp so that’s bad reporting too.
6 person groups get a lot of experience gained per event. So for EQ2, a six person group is the best way to get XP. Oddly, groups of 4 aren’t following a pattern. What suggests is that groups of 4 are more popular than they should be in spite of game mechanics — they are too popular for xp/event. Maybe 4 player content is a sweet spot wwe should look at.
Oddly, political extremists end up grouping with fewer people too!

{ 3 comments }
Awesome, you got the slides. My phone completely failed to take good pictures of course.
Fascinating stuff. Brings to mind Nick Yee’s Daedalus Project (http://www.nickyee.com/), the big MMO player survey that he ran for years. This is pretty powerful stuff, too, and if leveraged right could be worth quite a lot to the right people. I can see lots of MMOs being built with in-depth data tracking like this if there’s enough interest, to be redistributed as research data to anyone interested. Hopefully companies will do it out of the goodness of their hearts (and the positive PR), but only time can tell us that.
A parallel approach, not focused on players as physical entities but centered on the player behaviour expressed “in game” is found here: http://www.itu.dk/~yannakakis/CIG09_IOI.pdf
Comments on this entry are closed.
{ 1 trackback }